MCCS Facilities Exploratory Analysis
Note: The current report is based on utilization information unless otherwise noted.
Facility sustainment, restoration and modernization (FSRM) calculations are resource agnostic.
Data dictionary and assumptions are at the end of this report.
Raw data pulled from GoRPM on Dec 28, 2021
Download raw data: here
Download cleaned data: here
Exploring Costs
Costs by Category
| FY24 MCCS FSRM Costs by Category1,2 | ||||
|---|---|---|---|---|
| *iNFADS data retrieved Dec 28, 2021 | ||||
| Category | Sustainment | R & M3 | Total | |
| A | $30,158,564 | $52,290,361 | $82,448,925 | |
| B | $18,974,163 | $41,877,157 | $60,851,319 | |
| C | $42,646,223 | $48,736,971 | $91,383,194 | |
| Total | FSRM | $91,778,950 | $142,904,489 | $234,683,439 |
|
1
Funding agnostic
2
Nominal dollars
3
2.5% of PRV (MCICOM Metric for R&M & New Construction) inflated at 2% from FY21 to FY24
|
||||
Costs by Region
| FY24 MCCS FSRM Costs by Region1,2 | ||||
|---|---|---|---|---|
| *iNFADS data retrieved Dec 28, 2021 | ||||
| Region | Sustainment | R & M3 | Total | |
| MCIPAC | $41,117,906 | $63,905,165 | $105,023,071 | |
| MCIEAST | $20,363,433 | $33,088,602 | $53,452,035 | |
| MCIWEST | $18,219,501 | $26,253,303 | $44,472,804 | |
| SLTI | $6,533,357 | $9,863,429 | $16,396,786 | |
| MCINCR | $4,298,336 | $6,942,447 | $11,240,783 | |
| NONE4 | $1,246,417 | $2,851,543 | $4,097,959 | |
| Total | FSRM | $91,778,950 | $142,904,489 | $234,683,439 |
|
1
Funding agnostic
2
Nominal dollars
3
2.5% of PRV (MCICOM Metric for R&M & New Construction) inflated at 2% from FY21 to FY24
4
Garden City, Camp Elmore, Kansas City, MARFORRES, 4th MARDIV
|
||||
Costs by Region (Cat C)
| FY24 Cat C MCCS FSRM Costs by Region1,2 | ||||
|---|---|---|---|---|
| *iNFADS data retrieved Dec 28, 2021 | ||||
| Region | Sustainment | R & M3 | Total | |
| MCIPAC | $18,681,369 | $21,208,535 | $39,889,905 | |
| MCIEAST | $9,044,739 | $11,280,164 | $20,324,903 | |
| MCIWEST | $9,348,355 | $9,732,707 | $19,081,062 | |
| SLTI | $3,385,403 | $3,682,947 | $7,068,350 | |
| MCINCR | $1,901,558 | $2,409,974 | $4,311,532 | |
| NONE4 | $284,800 | $422,644 | $707,444 | |
| Total | FSRM | $42,646,223 | $48,736,971 | $91,383,194 |
|
1
Funding agnostic
2
Nominal dollars
3
2.5% of PRV (MCICOM Metric for R&M & New Construction) inflated at 2% from FY21 to FY24
4
Garden City, Camp Elmore, Kansas City, MARFORRES, 4th MARDIV
|
||||
Costs by Program
| FY24 MCCS FSRM Costs by Program1,2 | ||||
|---|---|---|---|---|
| *iNFADS data retrieved Dec 28, 2021 | ||||
| Program | Sustainment | R & M3 | Total | |
| Semper Fit Programs | $23,909,259 | $48,444,628 | $72,353,887 | |
| Exchange Operations | $18,208,727 | $24,148,345 | $42,357,071 | |
| Marine & Family Programs | $14,205,465 | $24,119,642 | $38,325,107 | |
| Commercial Recreation | $10,735,350 | $13,800,034 | $24,535,383 | |
| Clubs | $11,264,048 | $10,766,919 | $22,030,968 | |
| Children & Youth Programs | $7,083,068 | $12,897,706 | $19,980,775 | |
| Food & Beverage (Direct) | $5,174,677 | $5,292,827 | $10,467,504 | |
| Other Business Operations | $824,433 | $2,493,056 | $3,317,489 | |
| PCS Lodging | $326,458 | $821,890 | $1,148,348 | |
| TDY Lodging | $47,464 | $119,443 | $166,907 | |
| Total | FSRM | $91,778,950 | $142,904,489 | $234,683,439 |
|
1
Funding agnostic
2
Nominal dollars
3
2.5% of PRV (MCICOM Metric for R&M & New Construction) inflated at 2% from FY21 to FY24
|
||||
Use Category Top 10
Facility Type Code — The Facility Type Code determines the category code of the facility. The code ranges from category I to category IV and is tied to the DoD FAC Code. Each Category Code has an accompanying category use description.
There are a total of 72 distinct use categories within data set. The top 10 use category descriptions account for over 62% of the total costs in the MCCS portfolio.
| Top 10 most expensive iNFADS Use Category1,2,3 | ||||
|---|---|---|---|---|
| *iNFADS data retrieved Dec 28, 2021 | ||||
| Use Category | Sustainment | R & M4 | Total | |
| INDOOR PHYSICAL FITNESS CENTER (GYM) | $13,783,599 | $24,064,432 | $37,848,030 | |
| ALL HANDS CLUB | $10,967,225 | $10,464,905 | $21,432,130 | |
| EXCHANGE RETAIL STORE | $8,397,066 | $10,559,120 | $18,956,186 | |
| PLAYING FIELDS | $2,266,792 | $11,071,704 | $13,338,496 | |
| CHILD DEVELOPMENT CENTER | $3,548,234 | $8,376,756 | $11,924,990 | |
| EXCHANGE / MWR FOOD SERVICE | $5,174,677 | $5,292,827 | $10,467,504 | |
| LIMITED SERVICE OFFICIAL LODGING | $2,740,466 | $7,022,383 | $9,762,849 | |
| FAMILY SERVICES CENTER | $3,444,906 | $4,693,176 | $8,138,082 | |
| EDUCATIONAL SERVICES OFFICE | $2,728,822 | $4,155,499 | $6,884,321 | |
| YOUTH (6-18YRS) AND SCHOOL AGE CHILDREN (SAC) (6-12YRS) | $3,004,779 | $3,251,327 | $6,256,107 | |
| Total | FSRM | $56,056,566 | $88,952,128 | $145,008,695 |
|
1
Based on total FSRM costs
2
Nominal dollars
3
There are 72 use categories in dataset
4
2.5% of PRV (MCICOM Metric for R&M & New Construction) inflated at 2% from FY21 to FY24
|
||||
Program Costs Data Table
Exploring SqFt Utilization
Total utilization of MCCS according to iNFADS is 14,150,438 square feet (Total Measure = adq + iadq + sub).
Note: Utilization such as athletic fields, outdoor playing courts (basketball, volleyball, etc.), playgrounds and Marina/Boat Ramps are typically not included in total measure of square foot utilization)
Note: The trends are based on MCCS existing utilization by age.
Trends
What is the trend of square foot utilization by decade and Program?
Exchange Operations, Children and Youth and Semper Fit programs have been adding additional square footage utilization throughout the 2000 and 2010 decades (2000 - 2019). Additionally, Clubs, Commercial Recreation and less so in Lodging from the 2000 to the 2010 have slowed adding additional square footage within their programs. While Food and Beverage (Direct) and Other Business Operations have remained relatively flat.
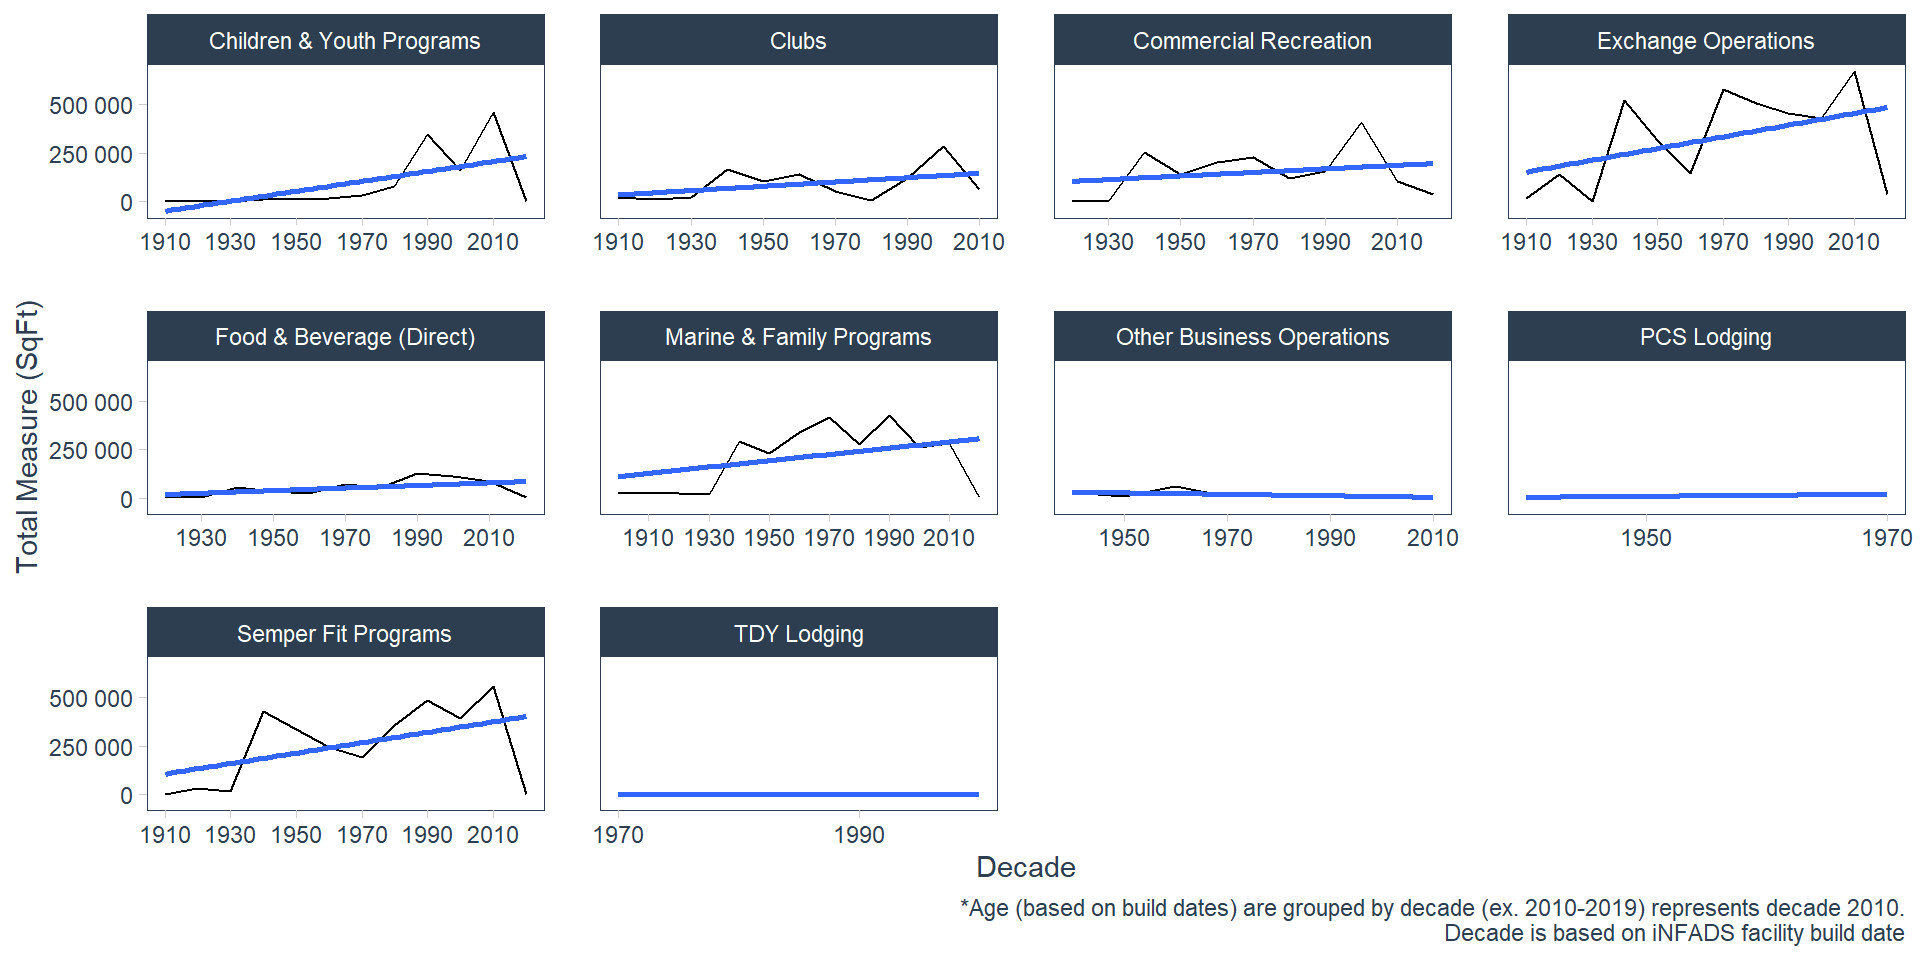
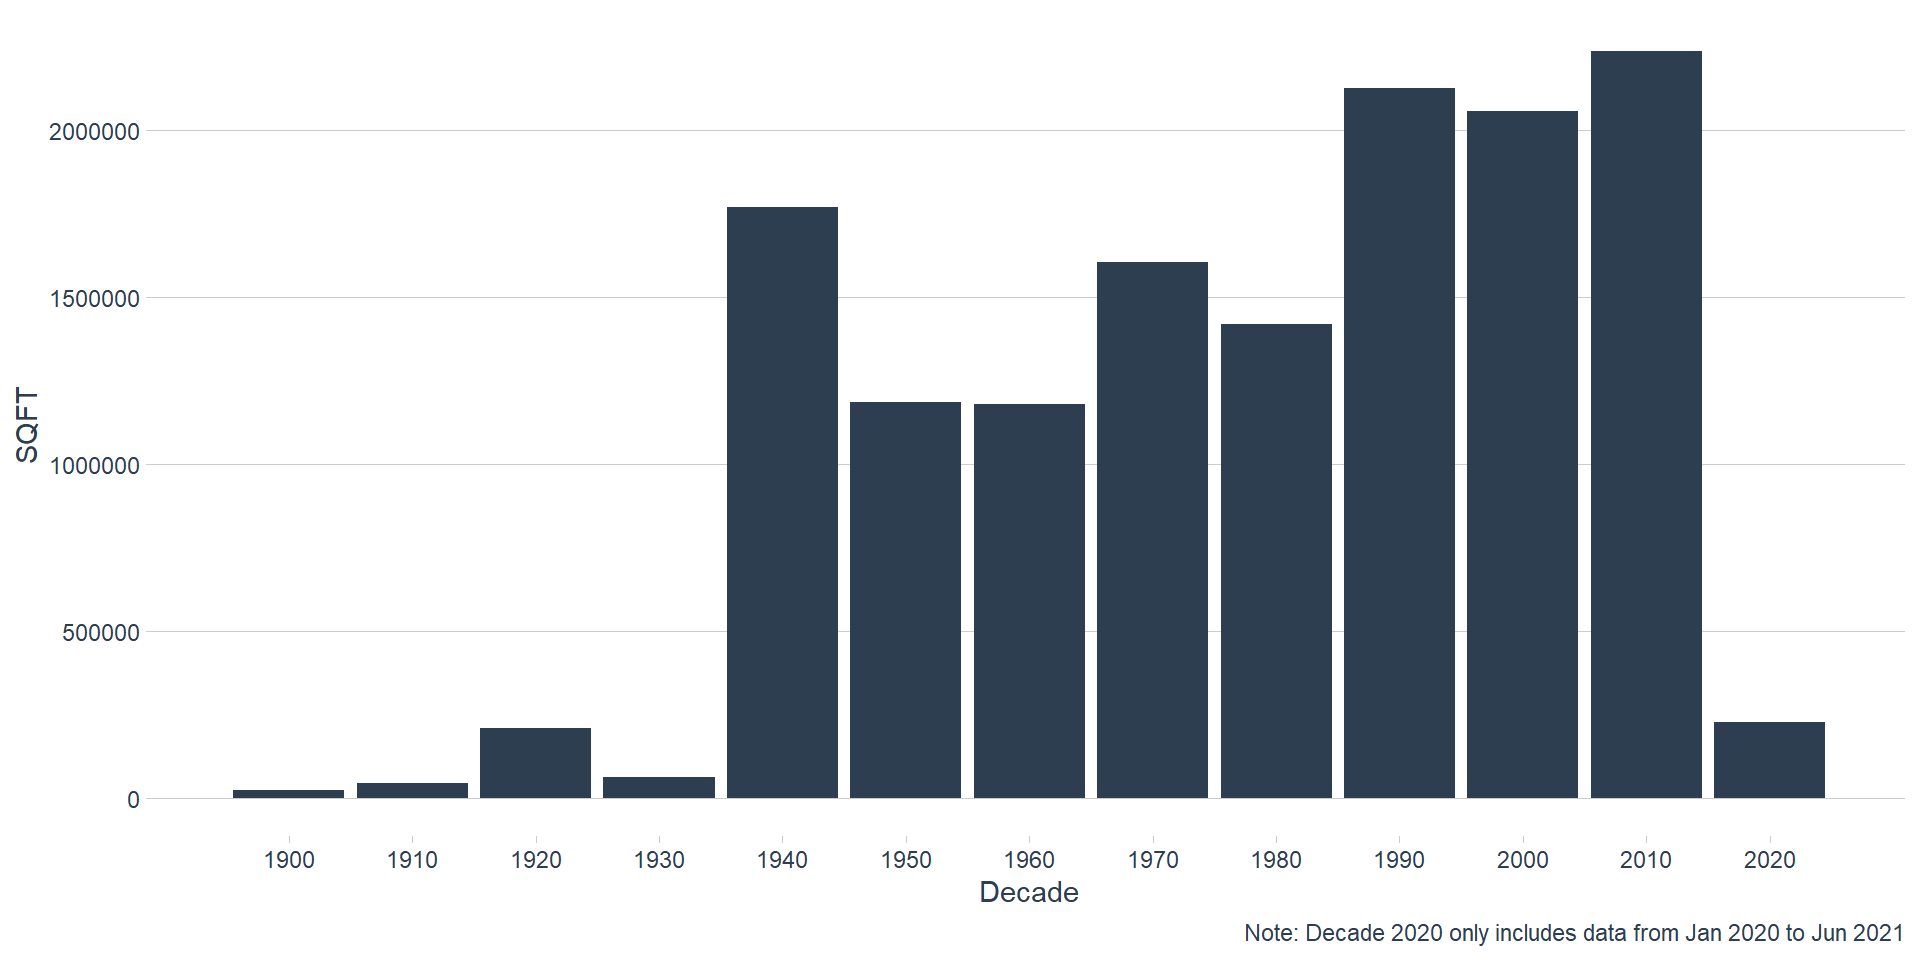
Square Footage by Decade based on Facility Build Date
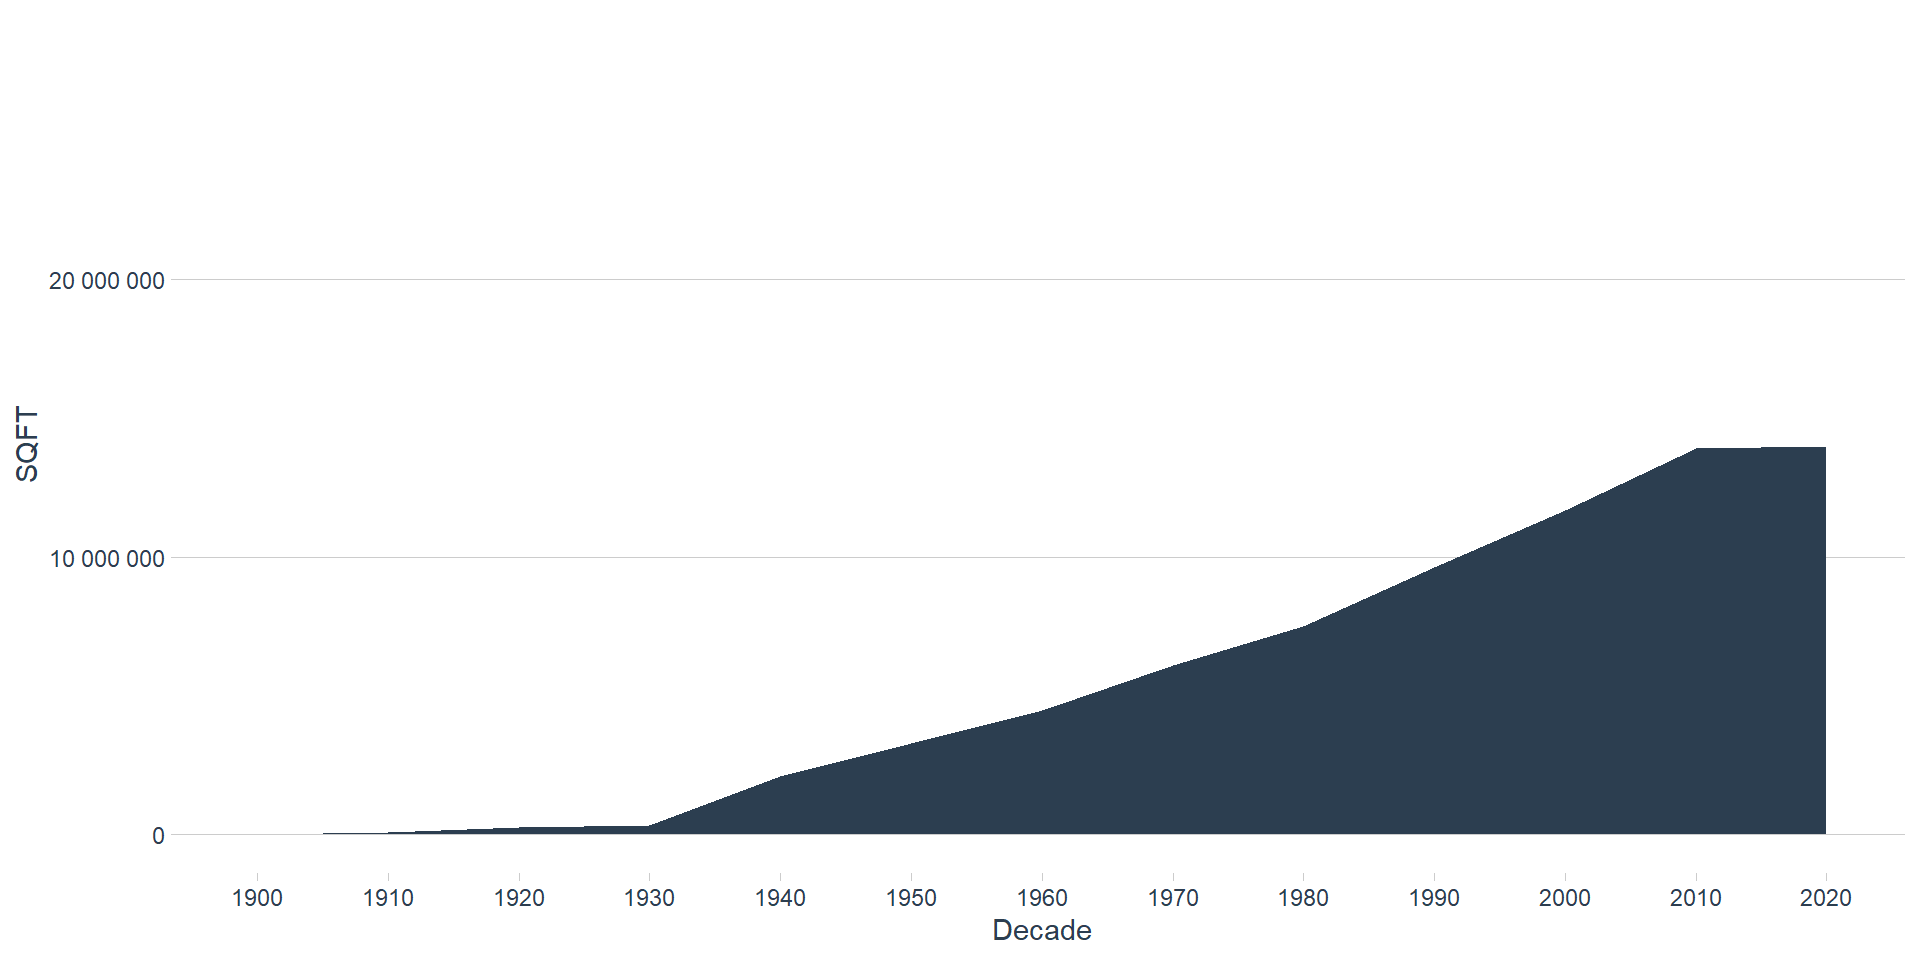
Cumulative Square Footage by Decade based on Facility Build Date
Percent of Total
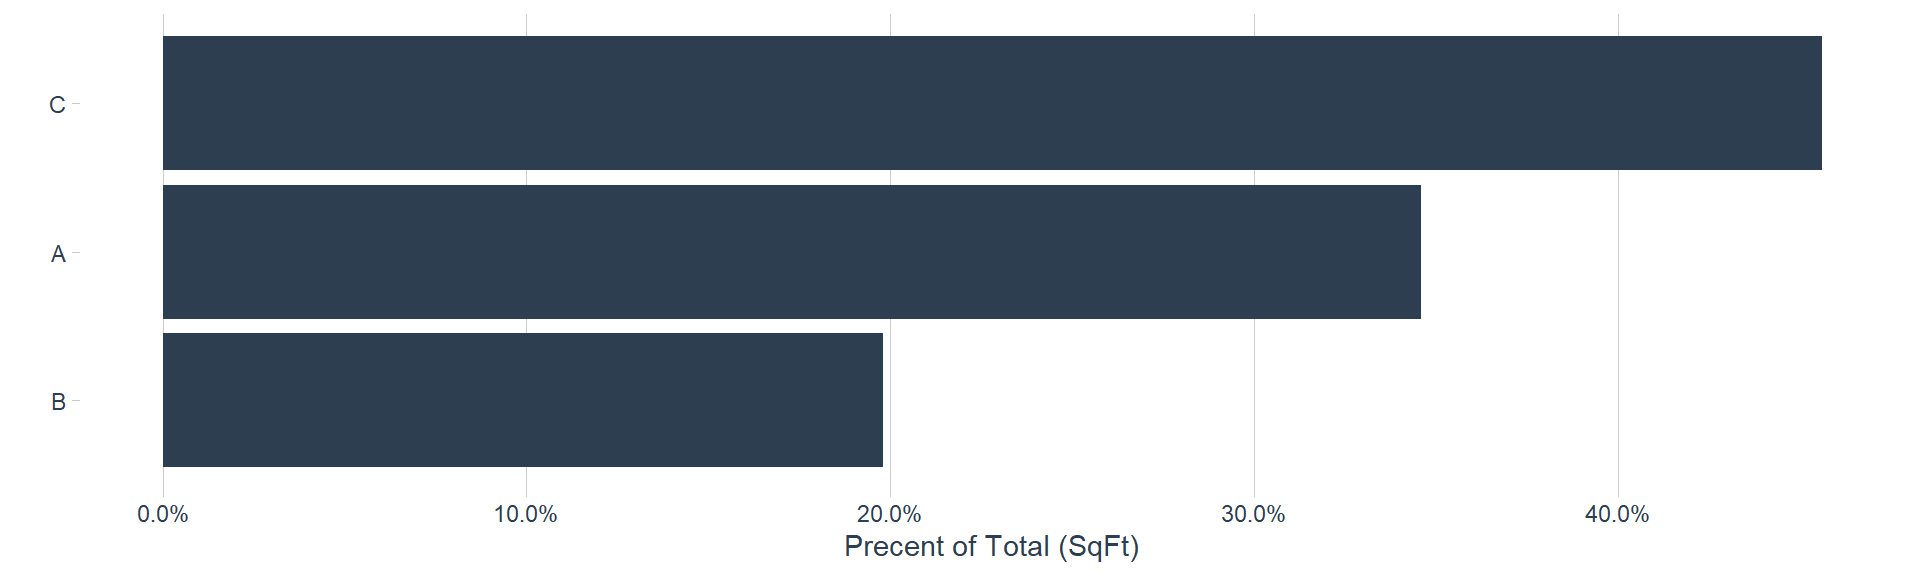
What is the percent of total square foot utilization by Category?
Category C accounts for 46% of MCCS total utilization.
What is the FSRM cost per square foot utilization by Category?
| FSRM SqFt Utilization Costs by Category | ||||
|---|---|---|---|---|
| *iNFADS data retrieved Dec 28, 2021 | ||||
| Category | Total FSRM1 | Total SqFt | Cost Per SqFT | |
| A | 82,448,925 | 4,895,217 | $16.84 | |
| B | 60,851,319 | 2,801,721 | $21.72 | |
| C | 91,383,194 | 6,453,500 | $14.16 | |
| Total | $234,683,439 | 14,150,438 | ||
|
1
Funding agnostic
|
||||
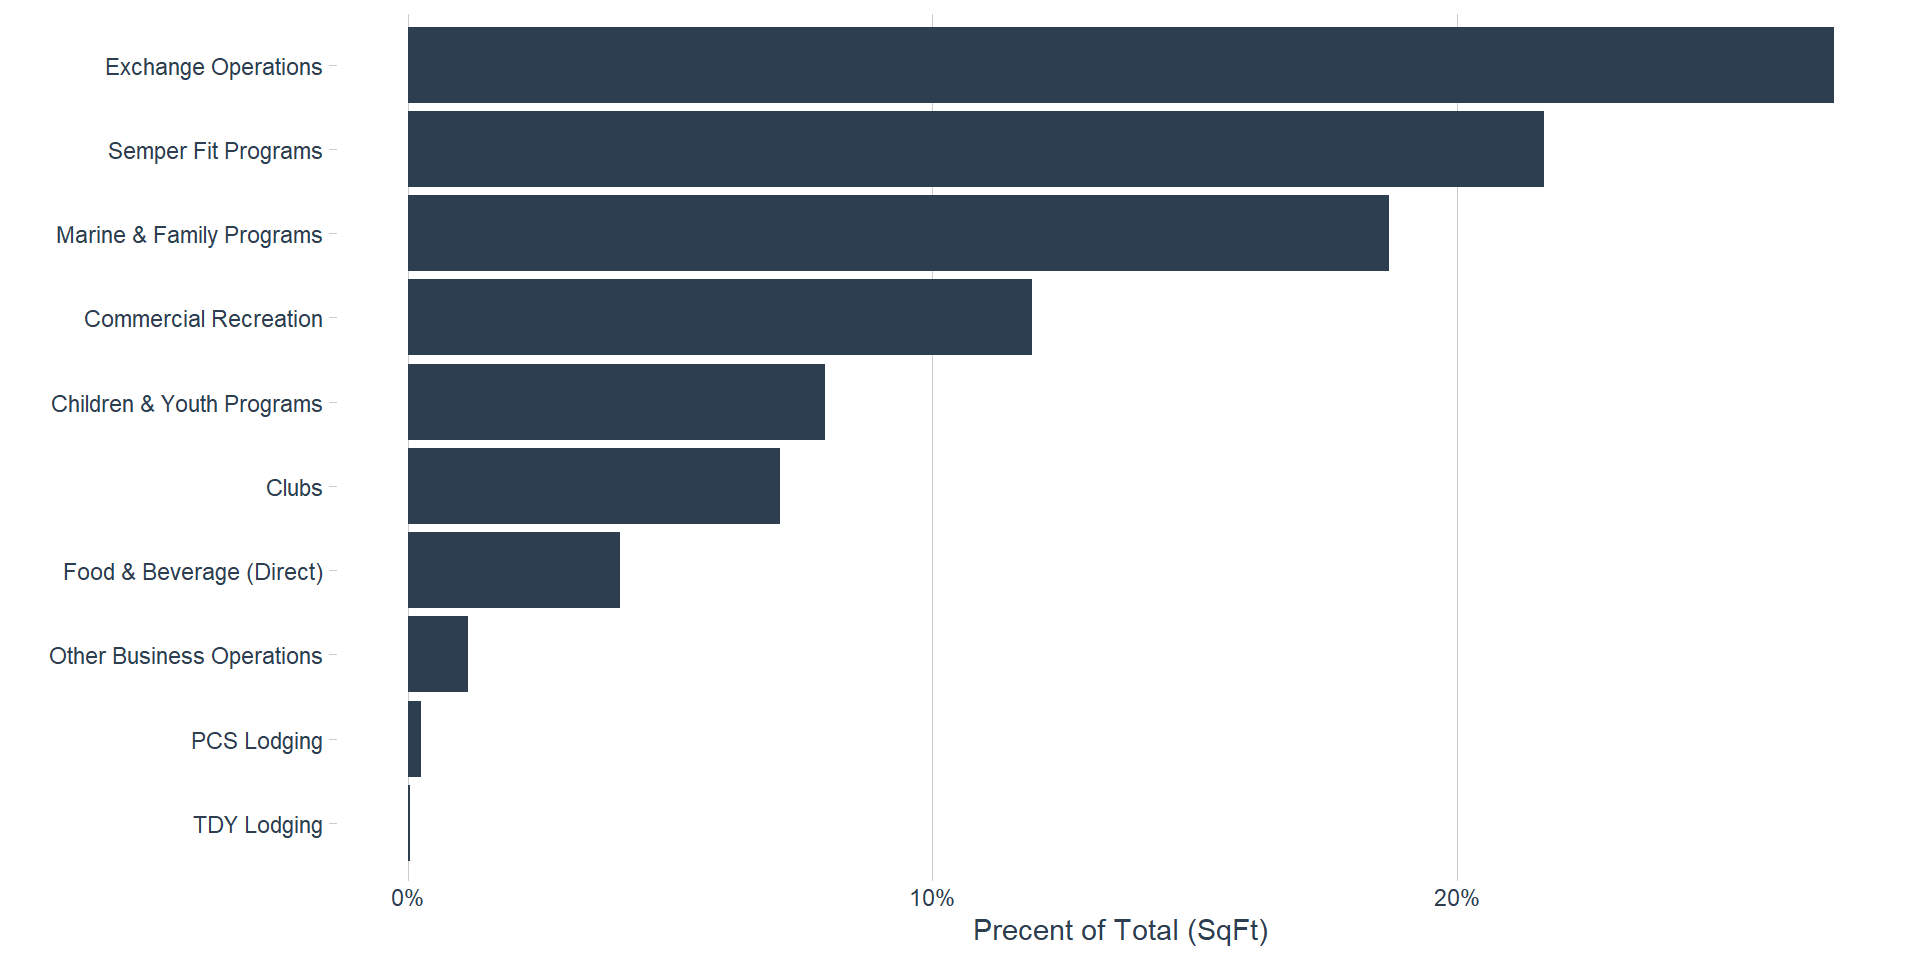
What is percent of total square foot utilization by Program?
Exchange Operations, Semper Fit Programs, Marine & Family Programs account for roughly 68% of MCCS total square foot utilization.
While Food & Beverage (Direct) only accounts for just over 4% of the total MCCS sqft utilization it ranks number 7 in total FSRM costs at a total cost of $10,467,504 or 4% of all FSRM costs.
What is the FSRM cost per square foot utilization by Program?
The cost per sqft by program is $20.60
The cost per sqft by program, excluding Food and Beverage (Direct) is $20.86
Food and Beverage (Direct) costs 2.7x more than the next most expensive cost per square foot.
| FSRM SqFt Utilization Costs by Program | ||||
|---|---|---|---|---|
| *iNFADS data retrieved Dec 28, 2021 | ||||
| Program | Total FSRM1 | Total SqFt | Cost Per SqFT | |
| PCS Lodging | 1,148,348 | 34,961 | $32.85 | |
| TDY Lodging | 166,907 | 5,366 | $31.11 | |
| Semper Fit Programs | 72,353,887 | 3,064,606 | $23.61 | |
| Clubs | 22,030,968 | 1,002,958 | $21.97 | |
| Other Business Operations | 3,317,489 | 162,395 | $20.43 | |
| Food & Beverage (Direct) | 10,467,504 | 573,631 | $18.25 | |
| Children & Youth Programs | 19,980,775 | 1,126,250 | $17.74 | |
| Commercial Recreation | 24,535,383 | 1,684,802 | $14.56 | |
| Marine & Family Programs | 38,325,107 | 2,648,384 | $14.47 | |
| Exchange Operations | 42,357,071 | 3,847,084 | $11.01 | |
| Total | $234,683,439 | 14,150,438 | ||
|
1
Funding agnostic
|
||||
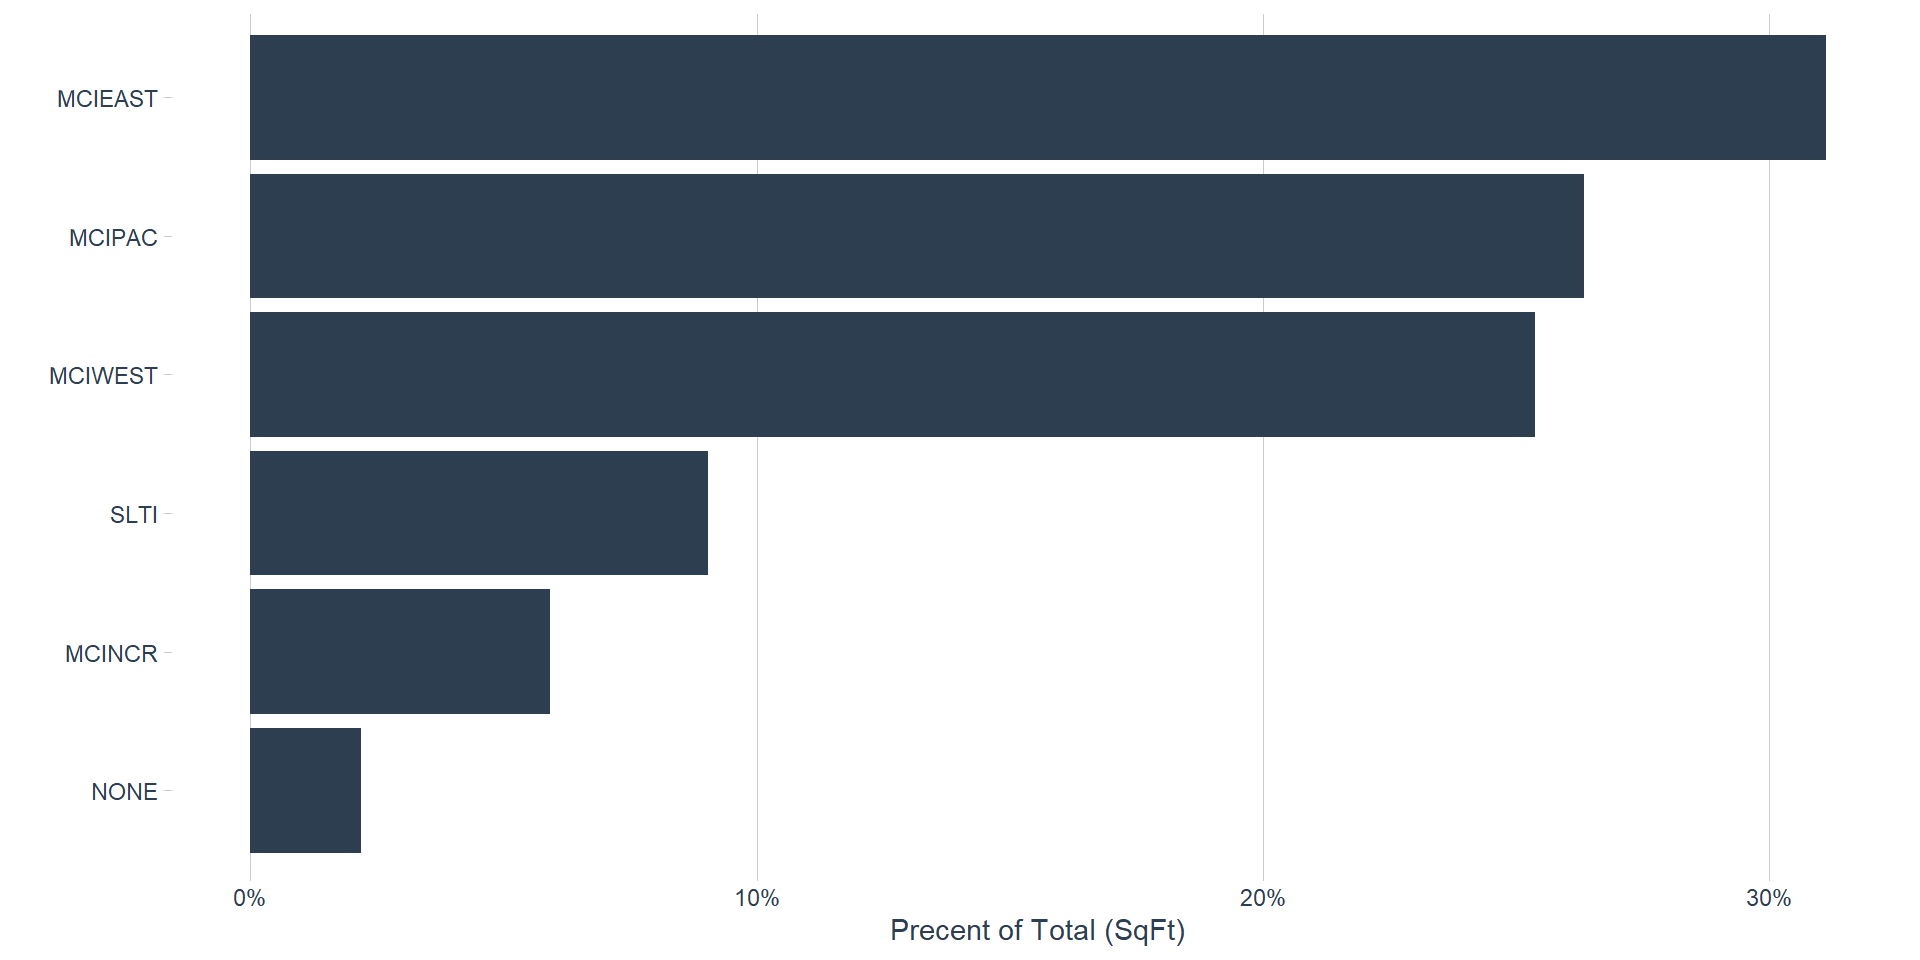
What is the percent of total sqft utilization by Region?
MCIEAST, MCIPAC, MCIWEST account for over 82% of the total MCCS square feet utilization.
What is the FSRM costs per square foot utilization by Region?
Locations without a Region have substantially greater costs for FSRM per square foot utilization.
| FSRM SqFt Utilization Costs by Region | ||||
|---|---|---|---|---|
| *iNFADS data retrieved Dec 28, 2021 | ||||
| Region | Total FSRM1 | Total SqFt | Cost Per SqFT | |
| MCIPAC | 105,023,071 | 3,727,992 | $28.17 | |
| MCINCR | 11,240,783 | 837,190 | $13.43 | |
| NONE | 4,097,959 | 310,151 | $13.21 | |
| SLTI | 16,396,786 | 1,279,277 | $12.82 | |
| MCIWEST | 44,472,804 | 3,591,105 | $12.38 | |
| MCIEAST | 53,452,035 | 4,404,722 | $12.14 | |
| Total | $234,683,439 | 14,150,438 | ||
|
1
Funding agnostic
|
||||
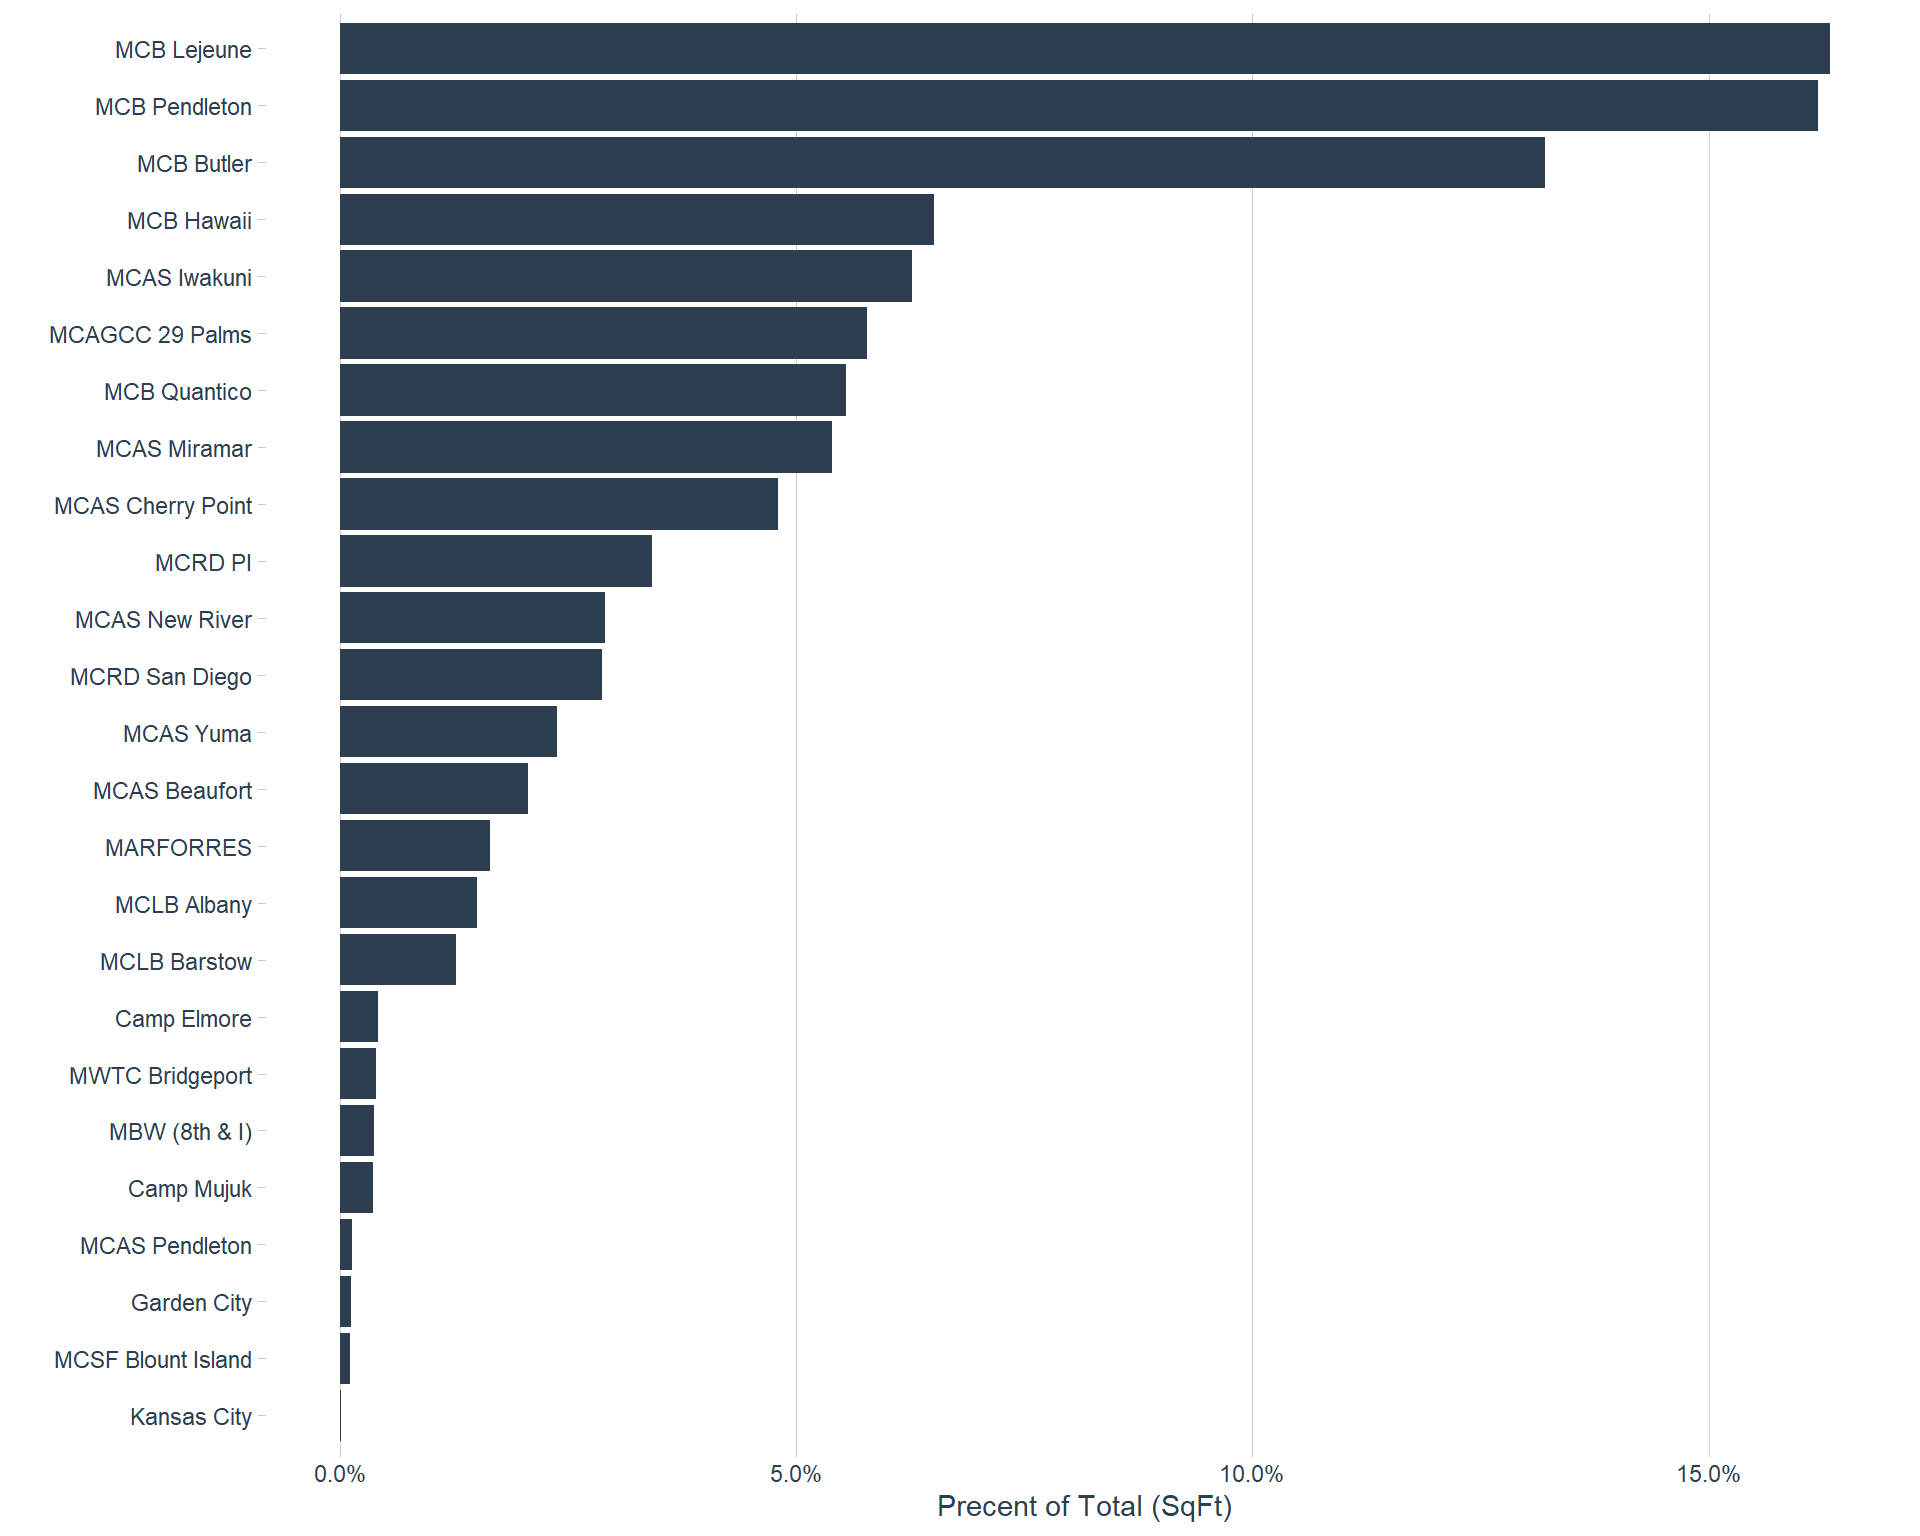
What is the percent of total sqft utilization by Installation?
Not surprisingly, Camp Lejeune and Camp Pendleton account for approximately 32% of the total square footage of MCCS. The below chart highlights the top 10 installation that account for 83% of MCCS total infrastructure.
| Top 10 Installations based on total square feet utilization aboard the Installation | |||
|---|---|---|---|
| *iNFADS data retrieved Dec 28, 2021 | |||
| Installation | Total SqFt | % of Total | |
| MCB Lejeune | 2,311,452 | 16.3% | |
| MCB Pendleton | 2,291,974 | 16.2% | |
| MCB Butler | 1,868,686 | 13.2% | |
| MCB Hawaii | 921,310 | 6.5% | |
| MCAS Iwakuni | 886,473 | 6.3% | |
| MCAGCC 29 Palms | 817,234 | 5.8% | |
| MCB Quantico | 784,822 | 5.5% | |
| MCAS Miramar | 763,400 | 5.4% | |
| MCAS Cherry Point | 679,679 | 4.8% | |
| MCRD PI | 483,409 | 3.4% | |
| Total | SqFt | 11,808,438 | 83.45% |
MCCS has facilities in 26 different locations. The below graph breaks down the percent of total square foot utilization by each location.
Exploring Q-Rating
Number of facilities by Q-Rating
Q1: 1472
Q2: 1063
Q3: 413
Q4: 82
Program
Q-Rating by Program and Category (based on facility)
Use the Search: box to sort or filter information in each table below.
Category
Q-Rating by Category (based on utilizations)
Region
Q-Rating by Region (based on facility)
Installation
Q-Rating by Installation (based on facility)
Exploring the age of facilities
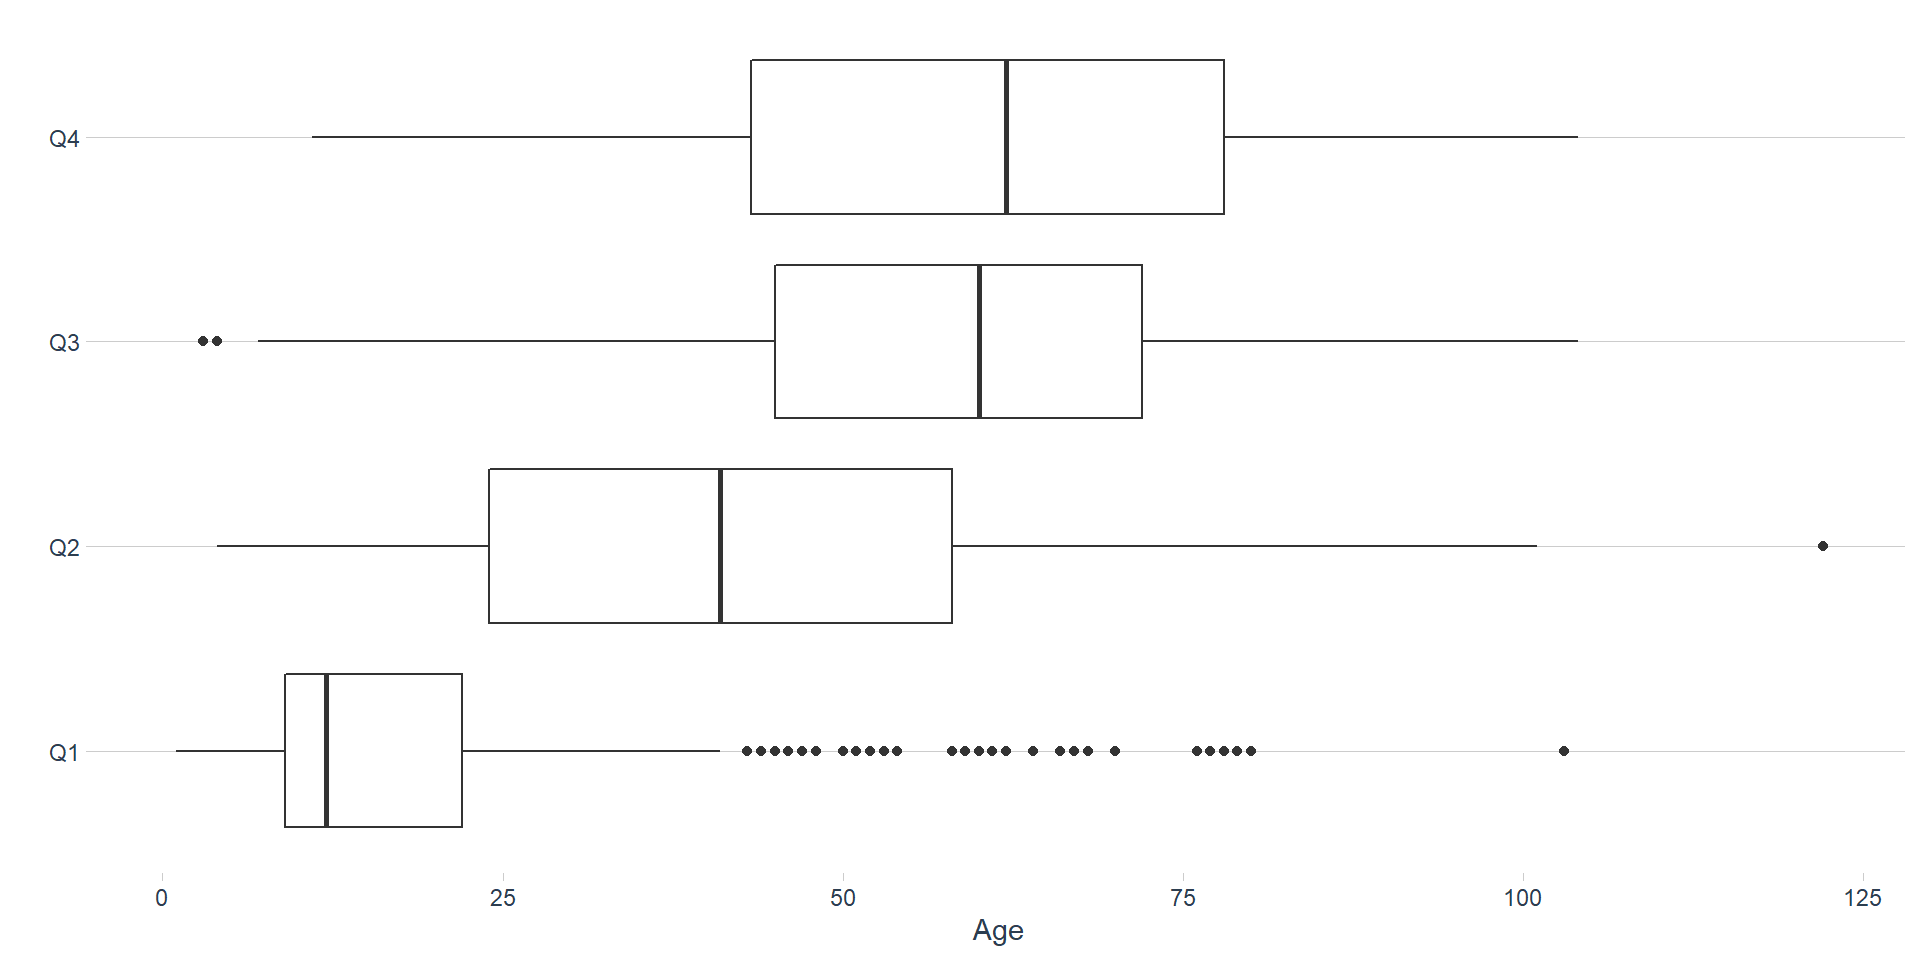
Q-Rating
How to read a boxplot:
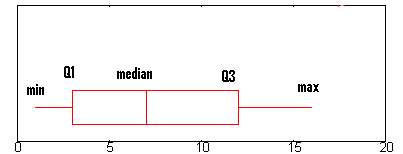
The box and whiskers chart shows you how your data is spread out. Five pieces of information (the “five number summary“) are generally included in the chart:
The minimum (the smallest number in the data set). The minimum is shown at the far left of the chart, at the end of the left “whisker.”
First quartile, Q1, is the far left of the box (or the far right of the left whisker).
The median is shown as a line in the center of the box.
Third quartile, Q3, shown at the far right of the box (at the far left of the right whisker).
The maximum (the largest number in the data set), shown at the far right of the box.
Inter-quartile Range (IQR): The IQR describes the middle 50% of values when ordered from lowest to highest. To find the interquartile range (IQR), first find the median (middle value) of the lower and upper half of the data. These values are quartile 1 (Q1) and quartile 3 (Q3). The IQR is the difference between Q3 and Q1.
If outliers are present, the whisker on the appropriate side is drawn to 1.5 * IQR rather than the data minimum or the data maximum. Black filled circles are used for known outliers.
Facility age by Q-Rating (boxplot)
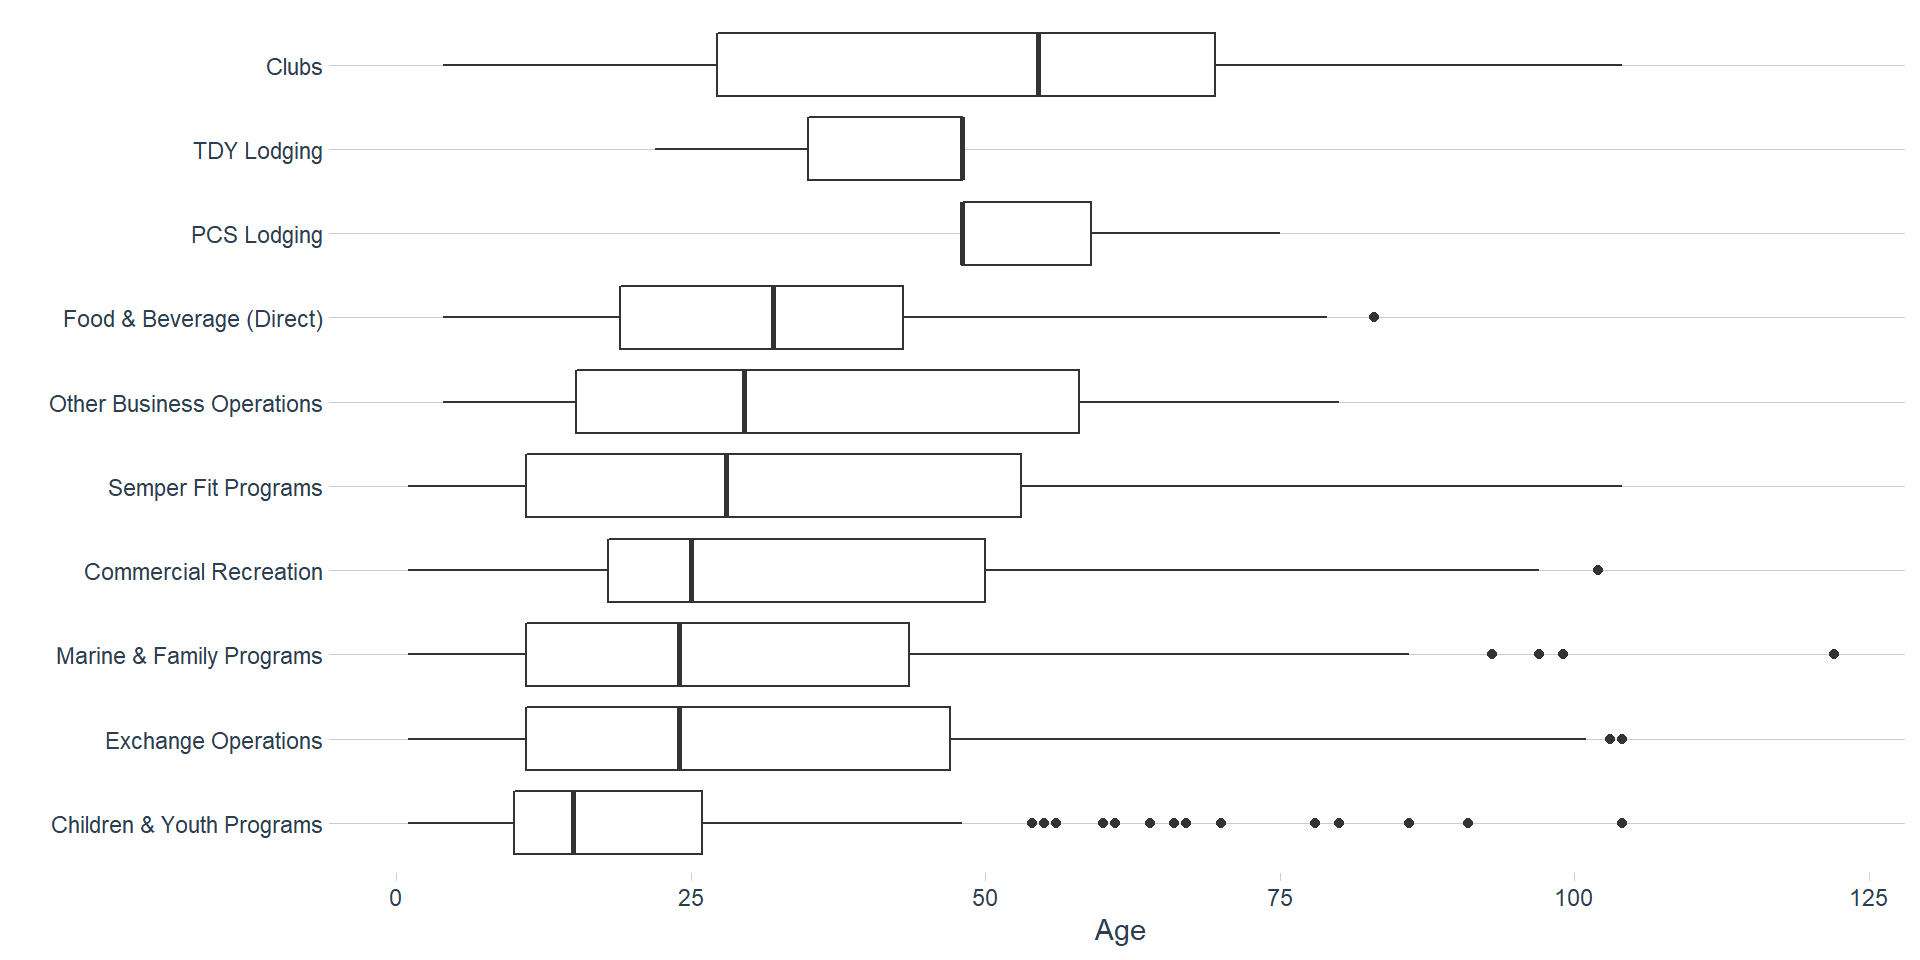
Program
Facility age by Program (Table)
Facility Age by Program (boxplot)
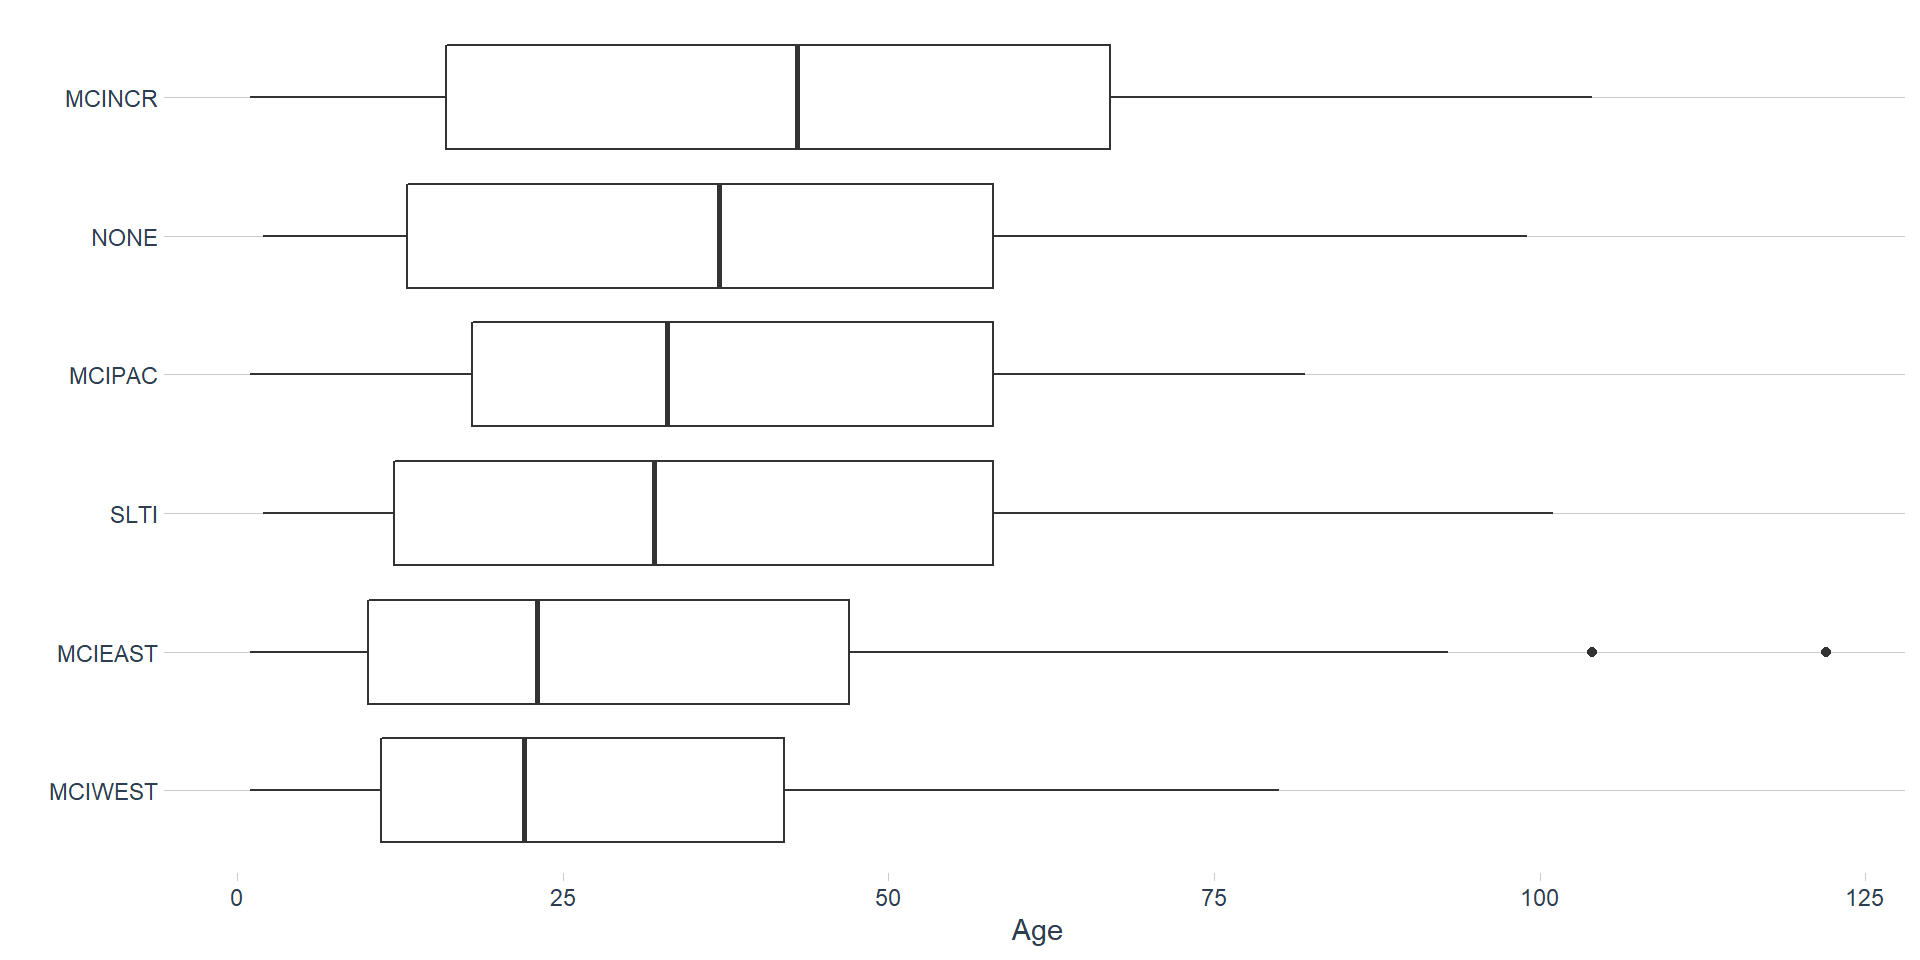
Region
Facility Age by Region (Table)
Facility Age by Region (boxplot)
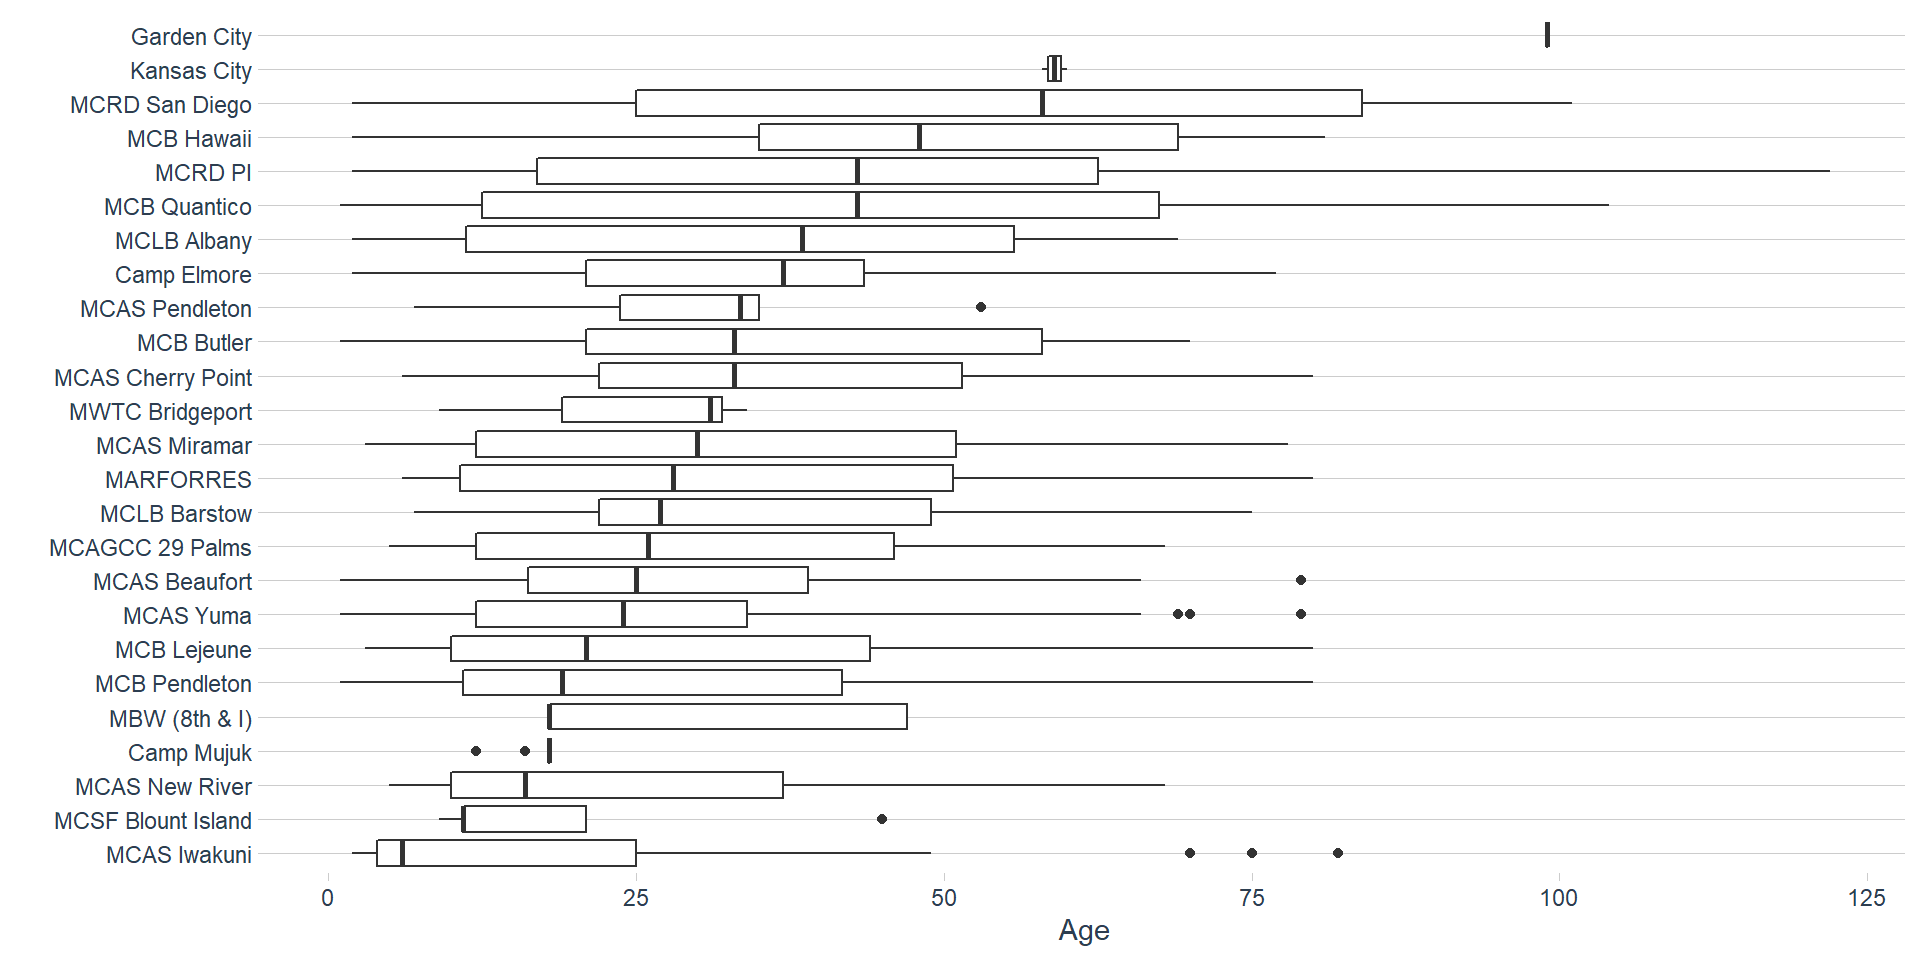
Installation
Facility Age by Installation (Table)
Facility Age by Installation (boxplot)
Data Dictionary
Region: Installations grouped within their perspective geographical region. There is a total of 5 regions (MCIWEST, MCIEAST, MCIPAC, MCINCR, SLTI) The following locations are not associated with a region in the data set:
Garden City
Camp Elmore
Kansas City
MARFORRES
4th MARDIV
Installation: The name of the installation MCCS services are provided. Installation is derived from the MCCS Installation Name column in iNFADS.
RPUID: The real property unique identifier (RPUID) is a non-intelligent code used to permanently and uniquely identify a real property asset. (Primary Key to connect facilities with utilization).
NAF Category, Program are mapped to iNFADS use_codes based on the the following:
use_code: A five-digit system of numbering a common nomenclature for classes 1 and 2 plant property. See NAVFAC P-72, Department of the Navy Facility Category Codes, for a listing of recognized codes.
use_desc: The title of the use category associated with the Category Use Code (use_code) derived from the Appendix A - Category Codes for Navy and Marine Corps Real Property Replacement for NAVFAC P72.
fac_use: Identifies the use of a Navy or Marine Corps facility (or portion thereof).
PRV: PRV is the cost to replace an existing facility with a generic facility that can perform the same function(s). The notional replacement facility is generally understood to be the same size and to occupy the same site as the existing facility. The notional replacement facility is also assumed to be constructed to current standards of materials and design. Since each facility has its own theoretical PRV, no facility PRV should contain costs associated with any other facility. Therefore, PRV costs are considered to extend only to the five-foot line surrounding the facility. This estimate applies to all facilities regardless of funding source and does not include land or leasing costs. The PRV is calculated at the Use level and is based on the standard DoD algorithm:
Plant Replacement Value = Facility Quantity1x Construction Cost Factor2x Area Cost Factor3x Historical Records Adjustment4x Planning and Design Factor5x Supervision Inspection and Overhead Factor6x Contingency Factor7
1 The Facility Quantity is the sum total of assets at the Use/User level.
2 The Construction Cost Factor is the cost value for a specific DoD Facility Analysis Code (FAC) and is “unit of measure” specific. This value is stored in the Category Code Module and updated upon the annual release of the latest version of the DoD Facilities Pricing Guide from a spreadsheet provided by NAVFAC HQ.
3 The Geographical Area Cost Factor is a value carried on the city table. This value is stored in the RPI and updated at year-end from a spreadsheet provided by NAVFAC HQ.
4 The Historic Records Adjustment Factor is an adjustment to account for increased costs for replacement of historical facilities or for construction in a historic district. The current factor is 1.05 and is based on the Historic/Heritage Asset data elements in iNFADS (DE 410a-d).
5 The Planning and Design Factor accounts for the planning and design of a facility. The current value of this factor is 1.09 for all but medical facilities and 1.13 for medical facilities. Assignment of this factor is based on the Category Code Number of the Use/User record.
6 The Supervision, Inspection and Overhead Factor accounts for the supervision, inspection, and overhead activities associated with the management of a construction project. The current value of the factor is 1.06 for facilities in the continental US (CONUS) and 1.065 for facilities outside of the continental US (OCONUS). Assignment of this factor is based on the Country Code and State Code.
7 The Contingency Factor accounts for construction contingencies; the current value of the factor is 1.05. PRV appears in the NAVFAC Public Works (Assessment) drills, Facility Maintenance Responsibility Report and various budget exhibits.
Sustainment: Sustainment provides resources for maintenance and repair activities necessary to keep an inventory of facilities in good working order over a 50-year service life. It includes regularly scheduled adjustments and inspections, preventive maintenance tasks, and emergency response and service calls for minor repairs. It also includes major repairs or replacement of facility components that are expected to occur periodically throughout the facility life-cycle.
GENERAL POLICY FOR SUSTAINMENT
The work includes regular roof replacement, refinishing wall surfaces, repairing and replacing heating, ventilation and air conditioning (HVAC) systems, replacing tile and carpeting, and similar type work. When sustainment involves replacement of constituent parts, the items installed shall serve the same purpose.
Sustainment does not include any construction. Sustainment does not include repairing or replacing non-attached equipment or furniture, or building components that typically last more than 50 years (e.g., foundation and structural members). Sustainment does not include repair work classified as restoration or modernization, environmental compliance, or historical preservation. Other tasks associated with facilities operations (such as custodial services, grass cutting, landscaping, waste disposal, and the provision of central utilities) are also not included.
Replacing landscaping destroyed by a sustainment project shall be classified as sustainment.
Sustainment: The calculation in this report for Cat C utilizations is 2x iNFADS FSM calculated Sustainment costs;
Cat A, Cat B and Lodging utilizations (FSM calculated sustainment costs)
Restoration and Modernization: Restoration and Modernization provides resources for improving facilities. Restoration includes repair and replacement work to restore facilities damaged by inadequate sustainment, excessive age, natural disasters, fire, accident, or other cases. Modernization includes construction or alteration of facilities solely to implement a new or higher standard (including regulatory changes), to accommodate new functions, or replace building components that typically last more than 50 years (e.g., foundations and structural members).
GENERAL POLICY FOR RESTORATION AND MODERNIZATION
Restoration and modernization does not include recurring sustainment tasks or certain environmental measures that are funded elsewhere.
Other tasks associated with facilities operations (such as custodial services, grass cutting, landscaping, waste disposal, and the provision of central utilities) are also not included.
R & M: The calculation in this report is based on 2.5% of the facilities Plant Replacement Value (PRV), this calculation assumes facility is fully recapitalized and that sustainment costs are being applied annually to each facility.
Adequate Area Measure (adq): The capacity or size in area measure of a facility or portion thereof that is in adequate condition and associated with a designated function (use) and a designated user. Adequate is defined as being capable of supporting the designated function without a need for capital improvements.
Adequate Other Measure (abq Other): The capacity or size in other measure of a facility or portion thereof that is in adequate condition and associated with a designated function (use) and a designated user. Adequate is defined as being capable of supporting the designated function without a need for capital improvements.
Adequate Alternate Measure (adq Alt): The capacity or size in alternate measure of a facility or portion thereof that is associated with a designated function (use) and designated user. Adequate is defined as being capable of supporting the designated function without a need for capital improvements.
Substandard Area Measure (sub) The capacity or size in the area measure of a facility or portion thereof that is in substandard condition and associated with a designated function (use) and a designated user. Substandard is defined as having deficiencies that prohibit or severely restrict, or will prohibit or severely restrict within the next five years due to expected deterioration, the use of a facility for its designated function. Capital improvements and/or repairs further define Substandard as having deficiencies that can be economically corrected (compared with replacement).
Substandard Other Measure (sub_other): The capacity or size in other measure of a facility or portion thereof that is in substandard condition and associated with a designated function (use) and designated user. Substandard is defined as having deficiencies that prohibit or severely restrict, or will prohibit or severely restrict within the next five years due to expected deterioration, the use of a facility for its designated function. Capital improvements and/or repairs further define Substandard as having deficiencies that can be economically corrected (compared with replacement).
Substandard Alternate Measure (sub_alt): The capacity or size in alternate measure of a facility or portion thereof that is in substandard condition and associated with a designated function (use) and designated user. Substandard is defined as having deficiencies that prohibit or severely restrict, or will prohibit or severely restrict within the next five years due to expected deterioration, the use of a facility for its designated function. Capital improvements and/or repairs further define Substandard as having deficiencies that can be economically corrected (compared with replacement).
Inadequate Area Measure (iadq): The capacity or size in area measure of a facility or portion thereof that is in inadequate condition and associated with a designated function (use) and a designated user. Inadequate is defined as having deficiencies due to physical deterioration, functional inadequacy or hazardous location which prohibit or severely restrict, or will prohibit or severely restrict within the next five years, the use of a facility for its designated function. Inadequate is further defined as having deficiencies, which cannot be economically corrected (compared with replacement) to meet the requirements of the designated function.
Inadequate Other Measure (iadq_other): The capacity or size in other measure of a facility or portion thereof that is in inadequate condition and associated with a designated function (use) and a designated user. Inadequate is defined as having deficiencies due to physical deterioration, functional inadequacy or hazardous location which prohibit or severely restrict, or will prohibit or severely restrict within the next five years, the use of a facility for its designated function. Inadequate is further defined as having deficiencies, which cannot be economically corrected (compared with replacement) to meet the requirements of the designated function.
Inadequate Alternate Measure (iadq_alt): The capacity or size in alternate measure of a facility or portion thereof that is in inadequate condition and associated with a designated function (use) and a designated user. Inadequate is defined as having deficiencies due to physical deterioration, functional inadequacy or hazardous location which prohibit or severely restrict, or will prohibit or severely restrict within the next five years, the use of a facility for its designated function. Inadequate is further defined as having deficiencies, which cannot be economically corrected (compared with replacement) to meet the requirements of the designated function.
Build_dt: The century and year, e.g., 20XX, when the initial construction of a Class 2 facility was completed. Where not available, a “best estimate” is used.
References: NAVFAC P-78 | NAVFAC P-72 | NAVFAC Appendix A P72 | MCO P11000.5G